A shadow analysis has become a required component of many local zoning codes, including both Boston and Cambridge. Over time, different jurisdictions have established limitations for areas prone to the negative effects caused by shadows arising from new construction – especially areas such as public spaces, community amenities and residential areas. These shadow analyses typically require that the architect illustrate the extent of the shadow impact caused by the proposed building on sensitive areas. In response to these requirements, teams for two recent projects – the BIDMC New Inpatient Building (NIB) and the Ragon Institute – have utilized a new method to generate and analyze shadows, allowing the projects to conform to respective zoning codes.
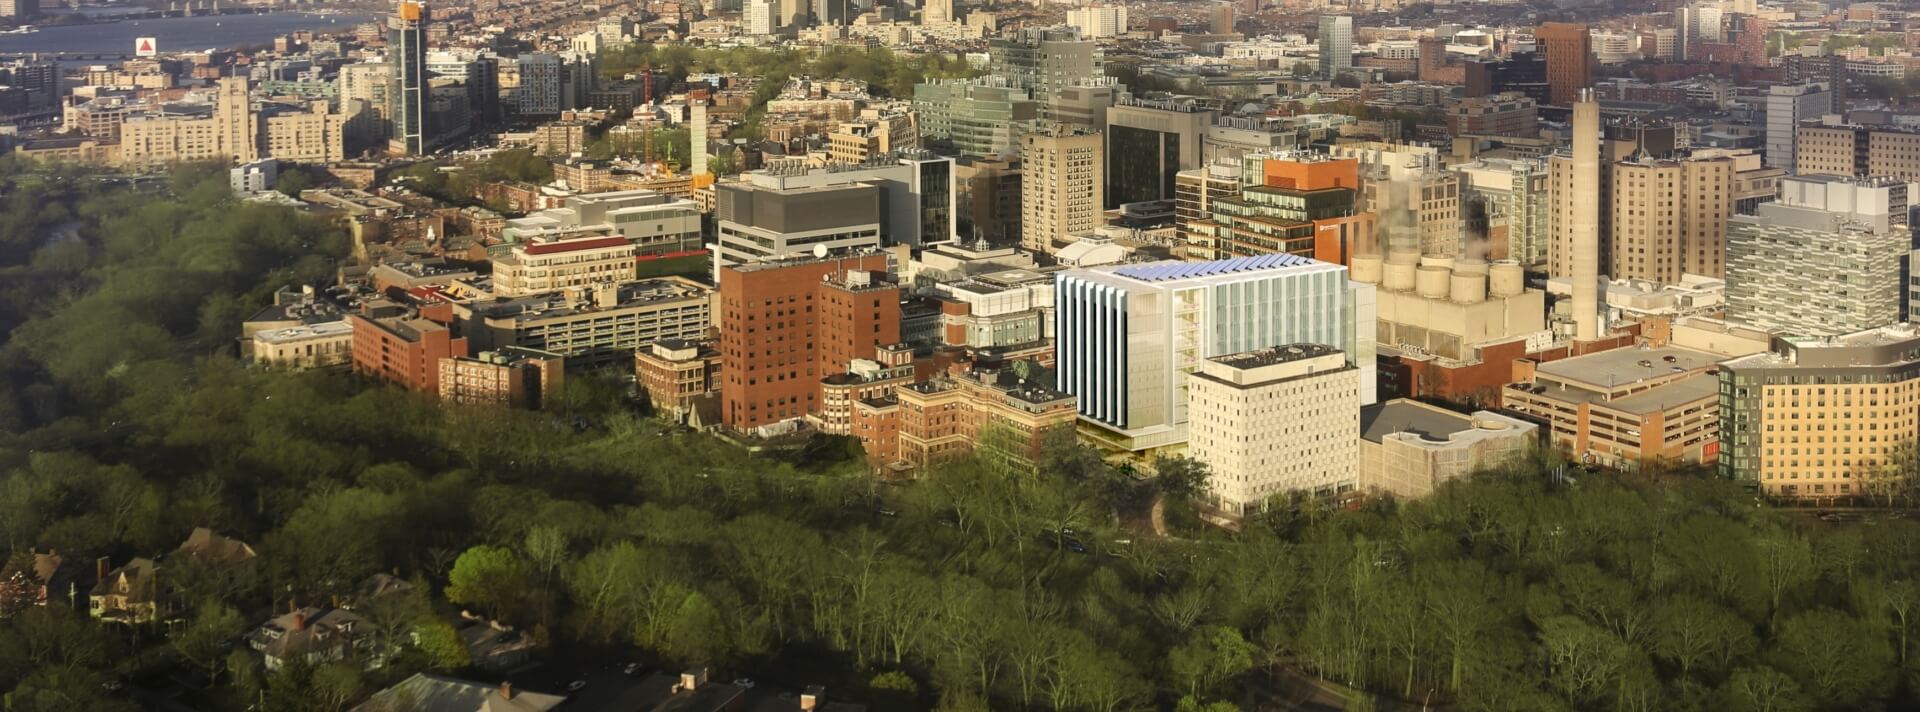
Located on BIDMC’s West Campus in the Longwood Medical and Academic Area (LMA), the new 380,000 square foot inpatient building will be built adjacent to BIDMC’s Rosenberg building and across the Riverway from Boston’s Emerald Necklace.
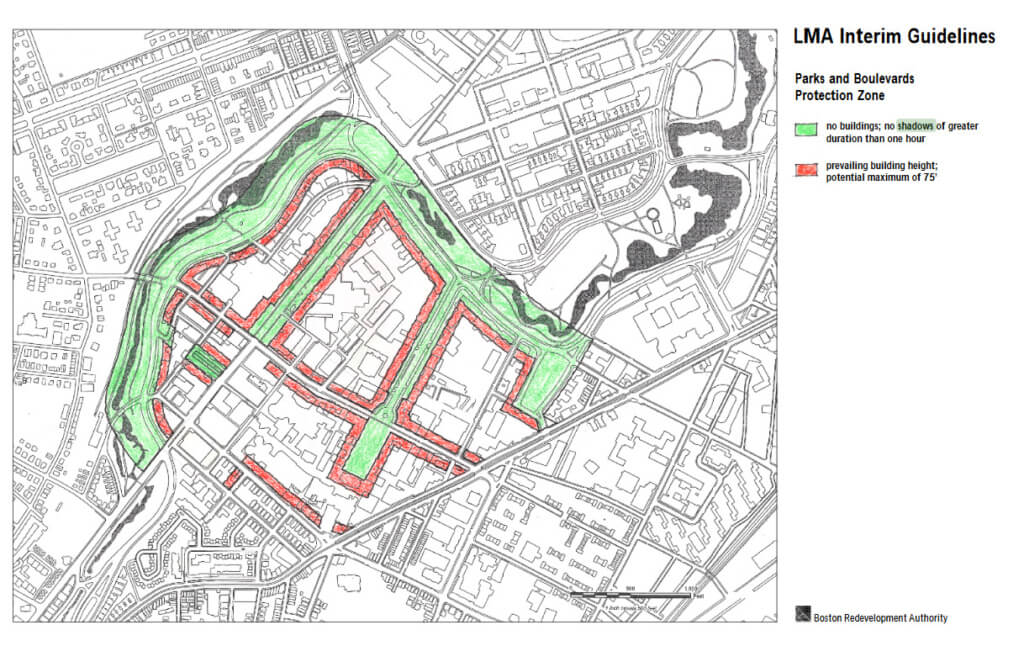
Figure 1: LMA Interim Guidelines
One of the LMA Interim Planning Guidelines’ purposes is to restrict new shadow impacts on the City of Boston parks with particular concern about projects that cast new shadows for more than one hour on the Vernal Equinox (March 21) on any location in the Emerald Necklace, Joslin Park or Evans Way Park (see Figure 1). Given this requirement, the documentation of net new shadows cast onto the Emerald Necklace by the NIB proved to be a unique exercise for the design team.
When first met with this task, a few questions were raised about how to analyze net new shadows lasting longer than one hour.
• First, how can we differentiate new shadows from existing shadows?
• What time does the new building first cast shadows onto the Emerald Necklace?
• What time does the shadow leave the Emerald Necklace?
• How do we analyze this in an efficient manner?
• How do we represent this in a legible and intelligible way?
The primary issue was that software such as Revit, Sketch-up, or even layer-based programs such as Photoshop failed to analyze new shadows because rendering engines typically calculate and generate shadows together. Methods such as isolating the new building and post-processing its individual shadows – separate from the shadows of an existing site – proved to be a tediously manual and sometimes inaccurate endeavor.
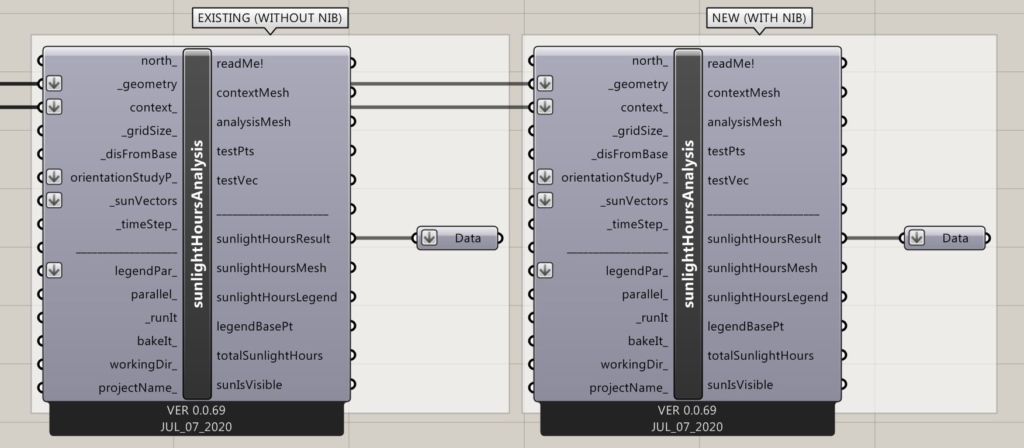
Figure 2: Grasshopper Ladybug: Sunlight Analysis of Existing Conditions vs Proposed Conditions
Therefore, an idea to have a parametric approach was brought forward. Through Grasshopper’s plugin, Ladybug, the strategy was simple: subtract the new shadows of the NIB with the shadows of the existing conditions from the data set from the shadows of the existing conditions (see Figure 2). Then, filter the remaining data through a process that determines which shadows exist for longer than one hour.
This method would not only prove to be the most accurate way of identifying new shadows, but also the most efficient in terms of analysis and post-processing time. The parametric method allowed the team to quickly analyze shadows for not only the Spring Equinox, but also shadows for the Autumnal Equinox, Summer Solstice, and Winter Solstice at a desired interval of time and resolution. In addition, the script allowed the BIDMC team to quickly study the effect of varying building height impacts on shadow projections and durations. (See Figure 3).

Figure 3: Grasshopper Inputs: Building Height Geometries
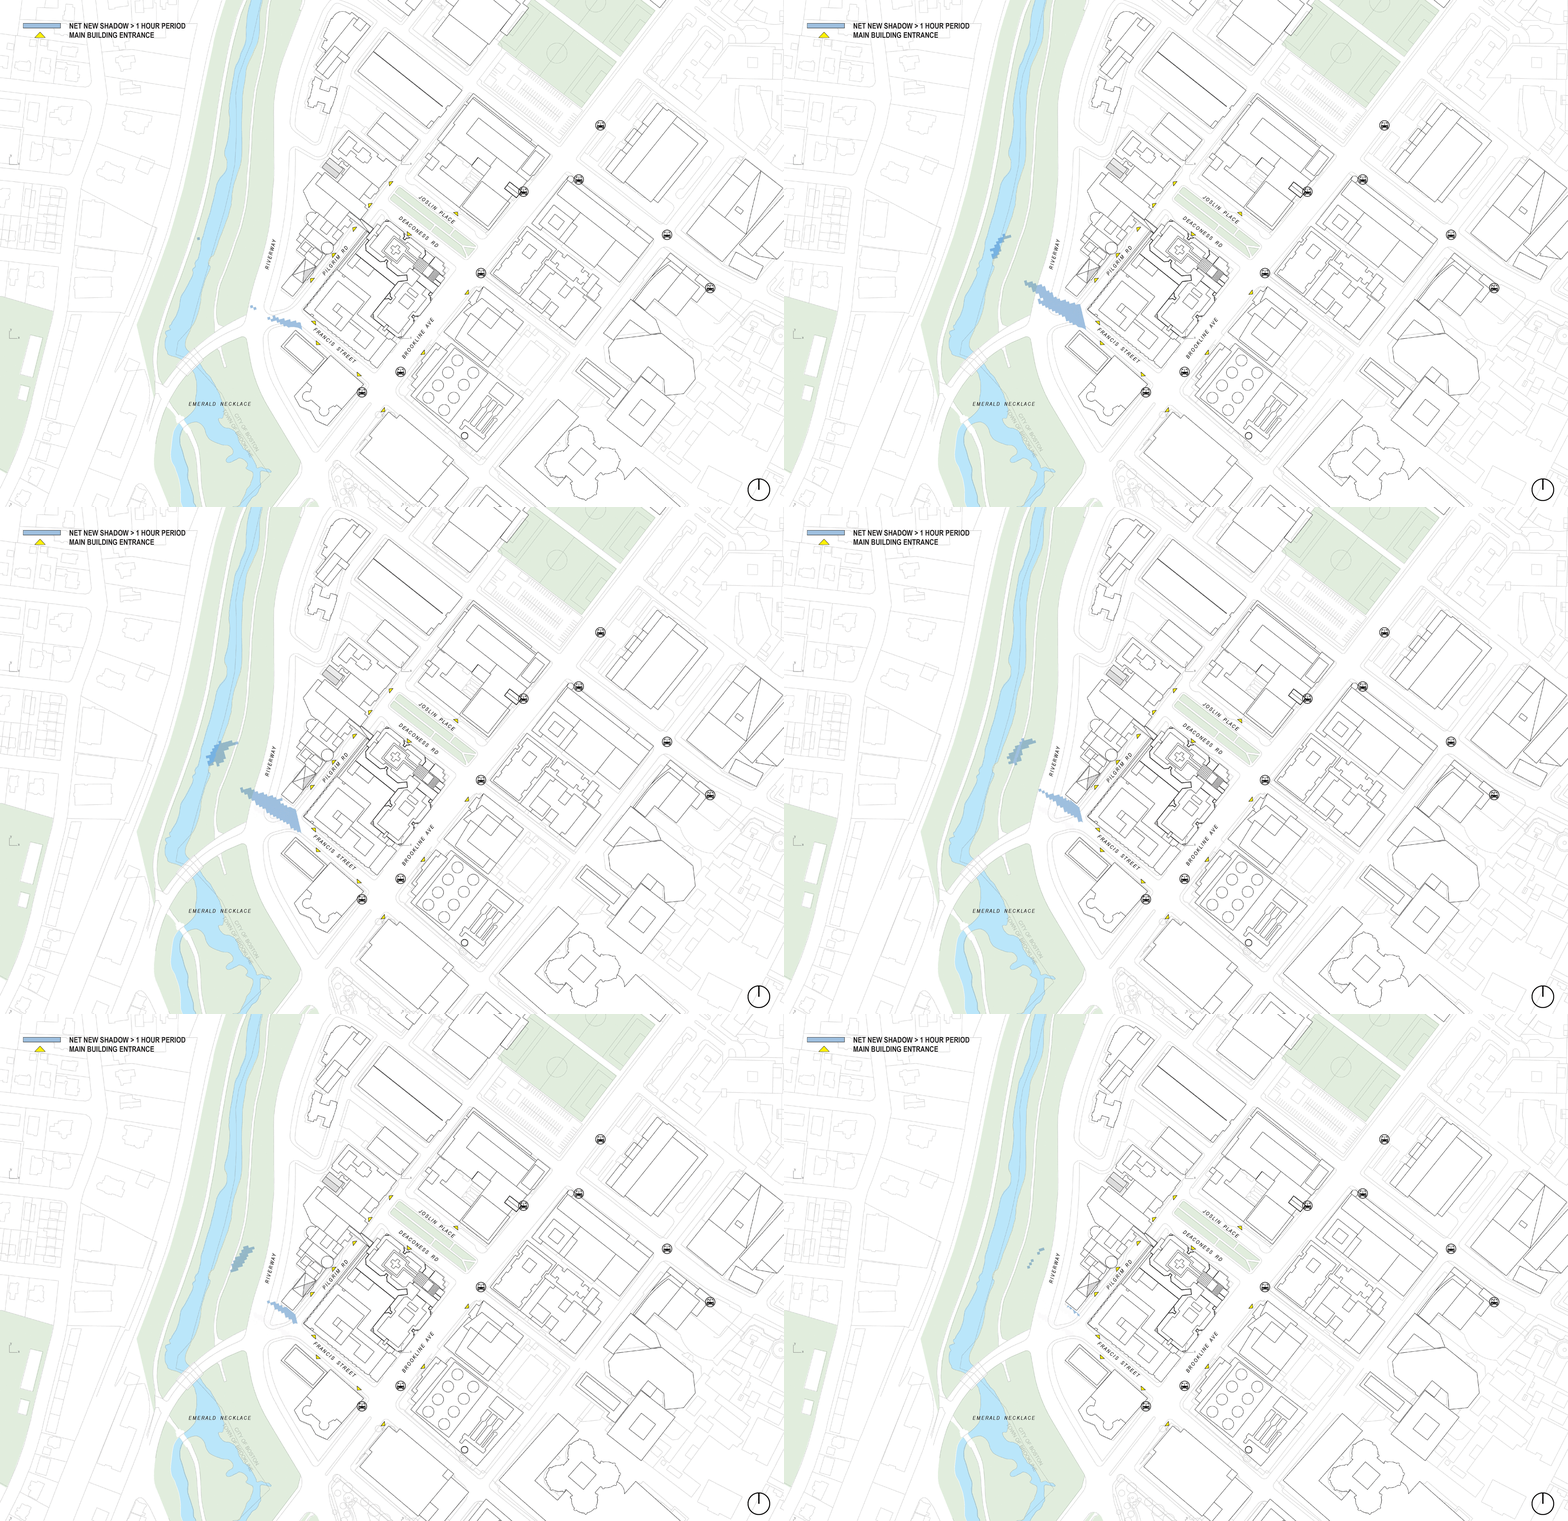
Figure 4: Time-lapse of Shadows Lasting Longer than One Hour Cast onto Emerald Necklace on March 21
This time-lapse (see Figure 4) is running at 10-minute intervals to illustrate the new building’s coverage of the Emerald Necklace for shadows lasting longer than one hour. Note the gap between the two masses of shadows along the Emerald Necklace. This is because the script has removed the shadows that would be cast by any existing buildings and/or structures. This gave both the client and the designers a better understanding of the building’s impacts and provided the basis for crafting a narrative for the city.
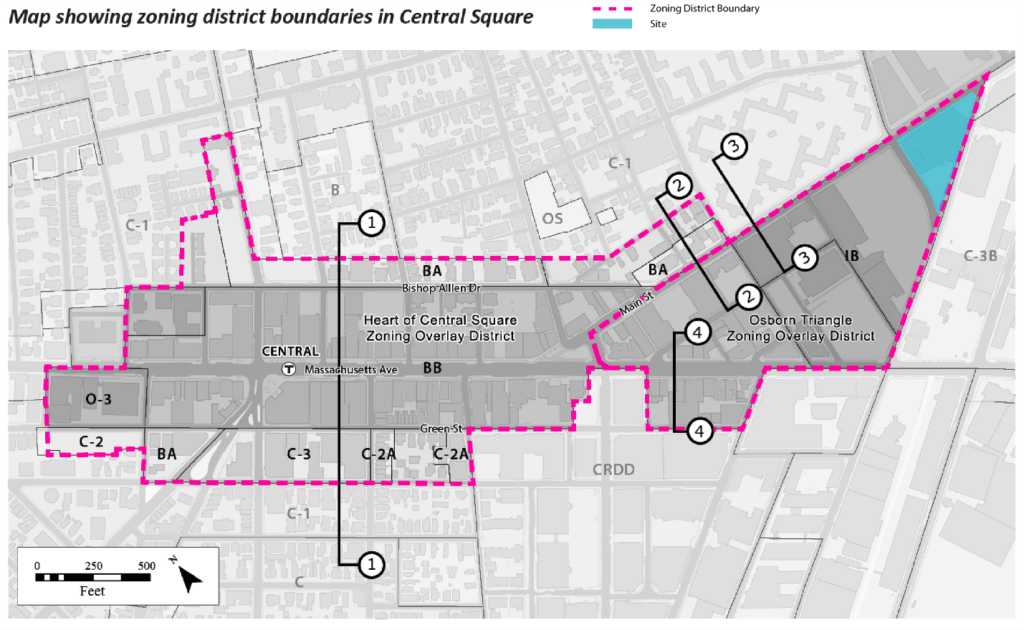
Figure 5: Central Square Design Guidelines 2013
A new 300,000 square foot research laboratory for the Ragon Institute will be built on a triangular plot bound by Main Street to the north, Portland Street to the west, and Albany Street on the southeast in Cambridge, MA. This site is within zoning district boundaries in Central Square (see Figure 5), and follows the shadow restrictions according to the Central Square Design Guidelines described below:
“Limit shadow impacts of new development on portions of neighborhoods outside the study area and public parks within approximately 1-2 blocks or 500 feet of the development site. Shadow impacts should not substantially reduce the appeal of public spaces, nor direct sun access to neighborhood housing, during spring and fall. Limit shadow impacts to no more than 2 hours per day between March 1 and October 31.”
Similarly, the project team was able to utilize the same script to address the net new shadows impact for Cambridge. Compared to the LMA Interim Guidelines (shadow impact no more than 1 hour), the Central Square Design Guidelines describe that shadow impacts should be no more than 2 hours. This means that Cambridge’s zoning code is slightly less restrictive than the LMA Guidelines. The script allows for easy threshold adjustment through a single input for allowable shadow durations. (See Figure 6).
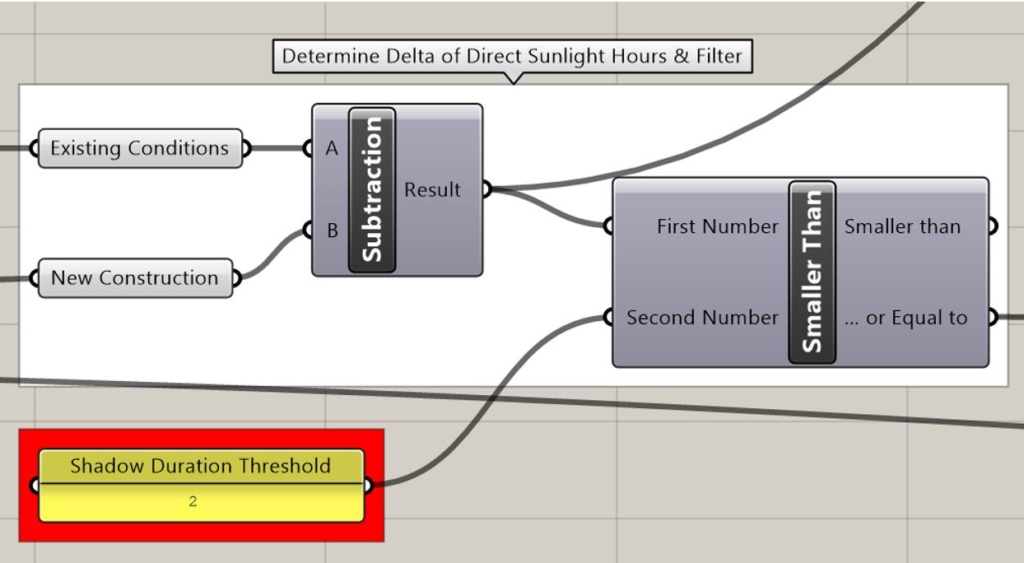
Figure 6: Shadow Duration Threshold
The investigation captured the days of March 1, June 21, and October 31. This was because the position of the sun (relative to the building) progressively rises from March 1 and reaches its apex on June 21 (the Summer Solstice), and proceeds to descend from June 21 to October 31. Thus, the information gathered during these key days can efficiently estimate the overall shadow impact and the area range from March 1 to October 31. Also, the daily time-lapse sequence of 9 am, 12 pm and 3 pm, and the additional time on 6 pm is collected during the summer solstice on June 21 due to the longest daytime (See Figure 7).
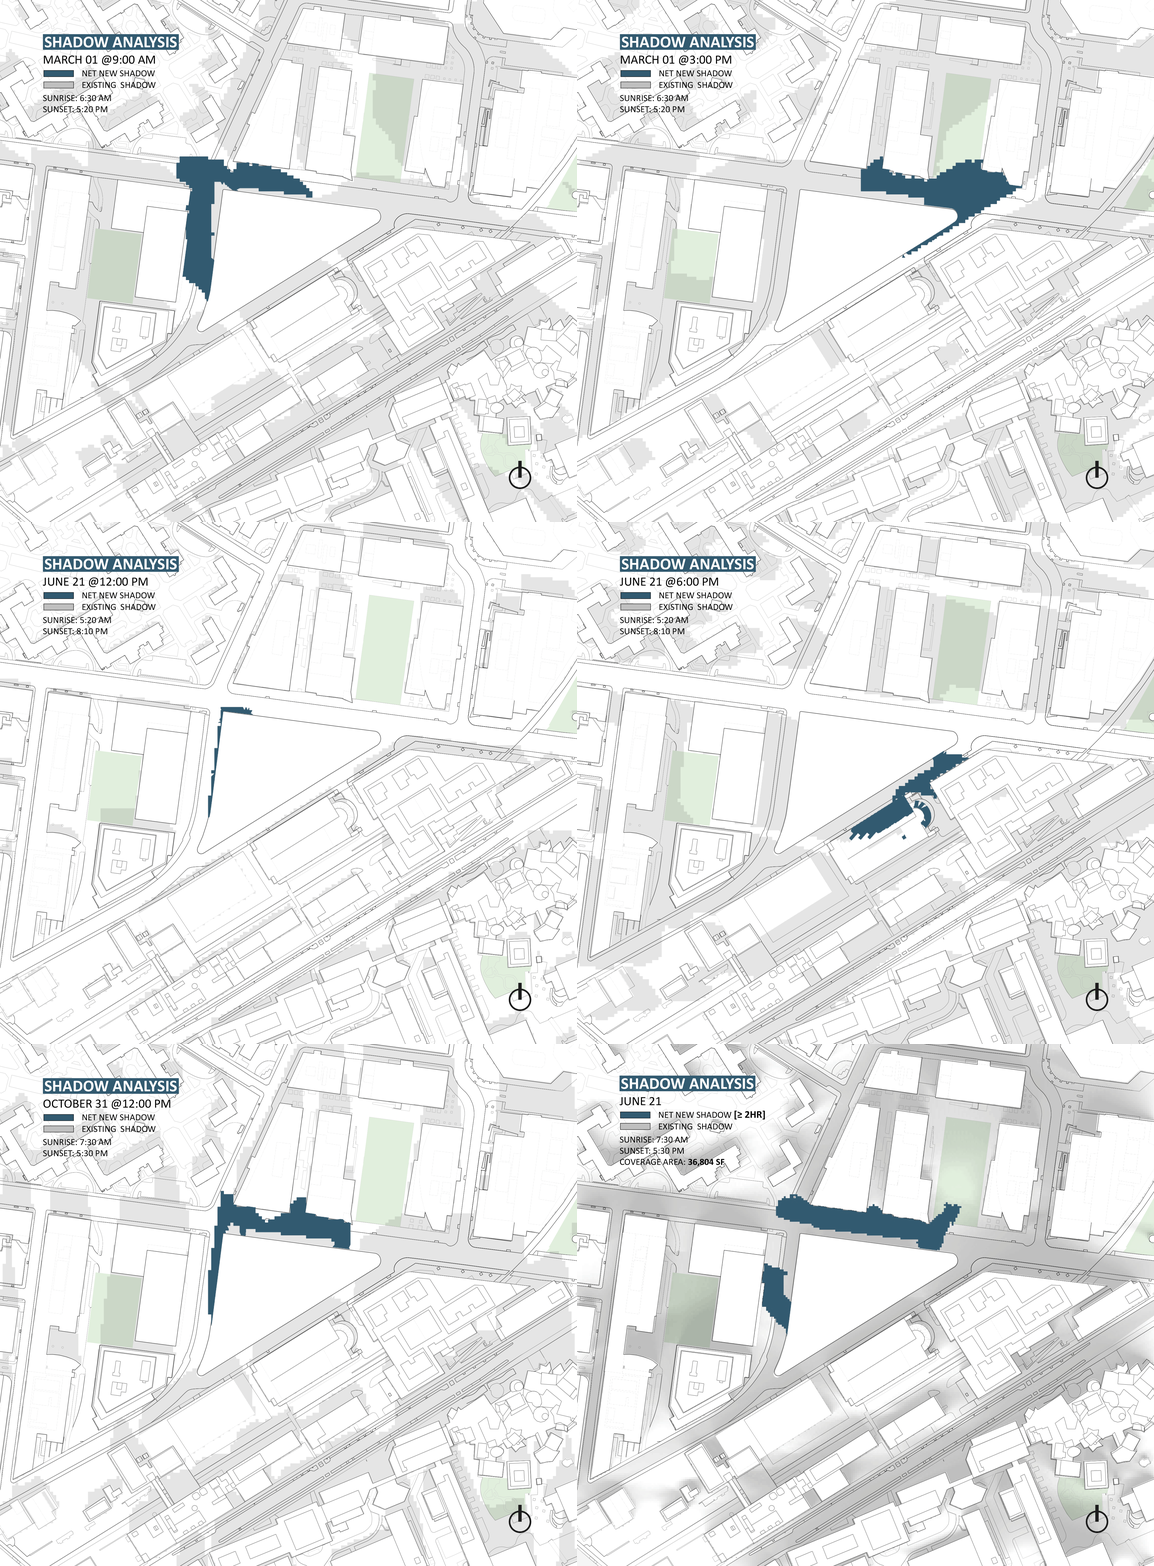
Figure 7: When the shadows impact greater than 2 hours on March 1, June 21, and October 31.
In all, this process has proven to be immensely useful for both project design teams. The custom-tailored definition was able to help the teams better understand the shadow impacts that each respective project would have upon their immediate context. This method establishes an accurate way of generating existing shadows, new shadows, identify new net shadows, while removing the need for inaccurate manual tracing. However, one drawback from this process is the visual aesthetics of pixelated shadow projections – an inherit result of the resolution of the analysis grid.
This approach could be applied to other shadow-related questions as well. Such as: calculating percentages of coverage in both indoor and outdoor shadows, tracking the behavior of shadow impacts on a building façade, and even expanded to analyze potential photovoltaic panel locations with suitable panel angles with its accumulated solar radiation impact. Future project teams that find themselves in a situation to fulfill certain shadow impact requirements and documentation can certainly utilize this resource.
