“We shape our buildings and afterwards our buildings shape us,” — a wonderful observation from Sir Winston Churchill on British Parliament’s interior design as encouraging confrontation and debate. Ian Donald, Environmental Psychologist at the University of Liverpool, states that environmental psychology tells us that behavior can be more accurately predicted from knowing where (one) is than knowing who they are. Our behavior is a product of our environment, and the environments we design are anything but random.
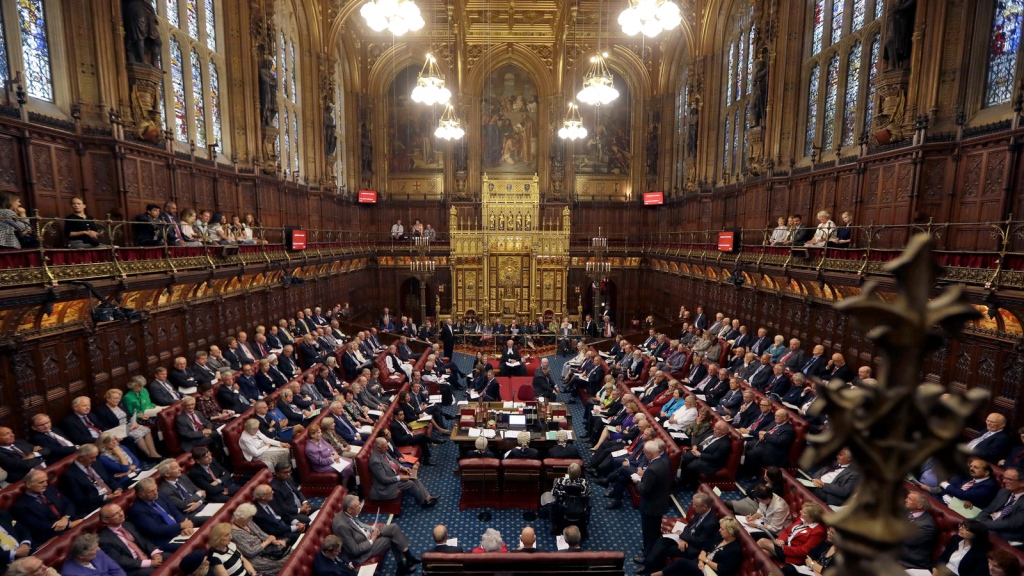
The British Parliament’s layout incites confrontation and debate. Behavior is a function of one’s environment.
Clients build for many strategic reasons – to attract the best people, achieve research objectives, or start new initiatives and academic programs – but the most profound impact of architecture on a client’s mission is the impact on culture, specifically the behaviors and interactions inspired by great design. We have reliable metrics, benchmarks and tools to solve for the strategic objectives, yet our methodology for designing and evaluating the cultural impact of architecture is often guided by intuition and speculation.
We can and should do better as an industry to articulate the value of designs that bring people together and encourage people to stay, meet, be together or share a pint. Togetherness is vitally important to a healthy society and critical to innovation. Communities that value being together develop intelligent processes, positive behaviors and a healthy culture. So, how can we measure architectural contribution to culture?
What attracts people to one place over another? What design strategies can we identify and translate to future projects? These questions have been a focus of Space Strategies for the past year starting with a talk at the 2023 AIA conference where Tom Simister, Diana Tsang and Laura Steinberg, Executive Director of the Schiller Institute at Boston College, proposed a new method for conducting post occupancy evaluation.
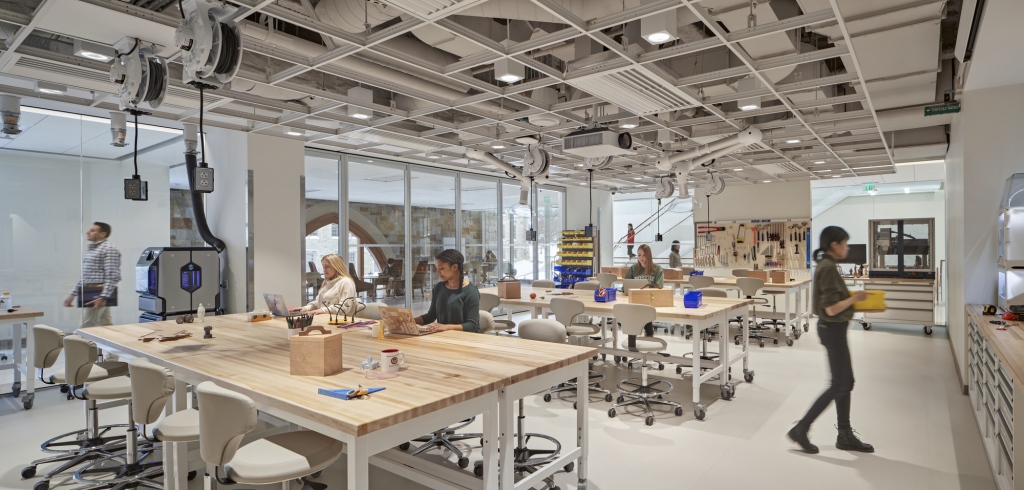
Boston College’s new interdisciplinary building, 245 Beacon Street, opened in 2023 and was immediately flooded with students from all disciplines.
We developed a three-step process beginning with a user experience survey followed by a site visit and culminating in a summary of findings. Schiller’s research into Interdisciplinarity in the Academy informed the user experience survey questions and provided a methodology for analyzing the results. PAYETTE’s new building, 245 Beacon Street, at Boston College , served as a pilot for the user experience questionnaire utilizing PAYETTE’s interactive survey, Pulse, as the survey instrument. The pilot survey was meant to test questions and provide a quick dataset for analysis. The survey asked for basic demographic information including major, departmental affiliation and whether one has assigned space in the building. In the period of two weeks, 56 people responded and identified 206 locations in the building where they have experienced both planned and unplanned interactions.
PAYETTE’s Pulse survey tool allows respondents to mark locations in response to questions. Results are displayed as dots or lines allowing responses from multiple questions to be overlayed and compared.
The results were interesting, and Pulse proved to be a compelling way to ask questions and map responses. Most interactions were planned. The majority related to research occurred in office areas or at desks in write-up areas. The intentional use of informal places in the building was surprising. Meaning, people had more planned meetings than impromptu meetings in places designed for informal interaction – the café, kitchenettes and casual seating areas. We realized that POE surveys should dig deeper into interactions and ask about the duration of time that people spend in each place, and provide feedback about transparency, acoustics, access to power or wifi – design elements that encourage people to linger and connect.
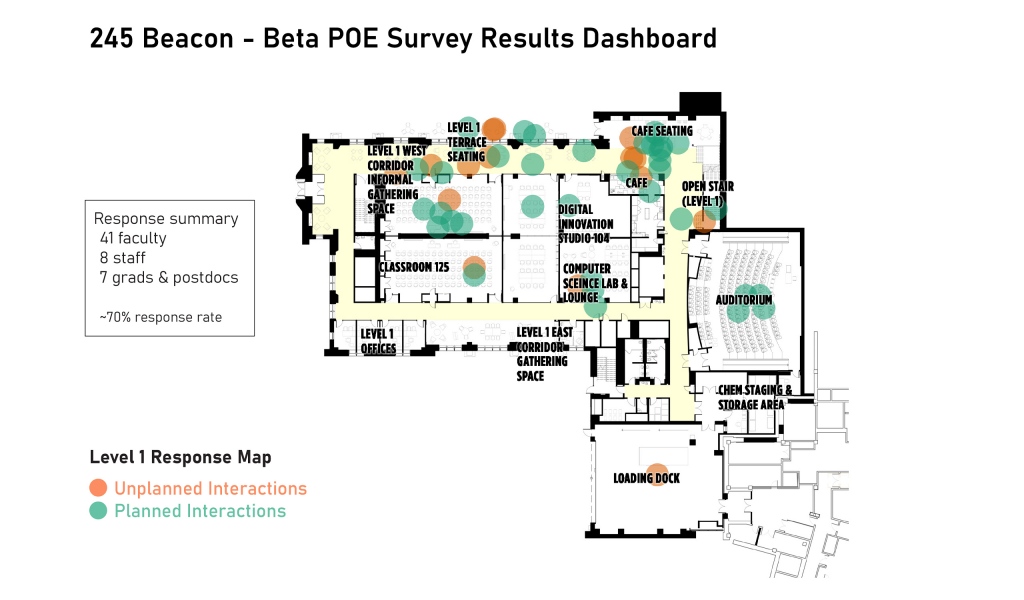
Mapped responses reveal patterns of interaction in buildings.
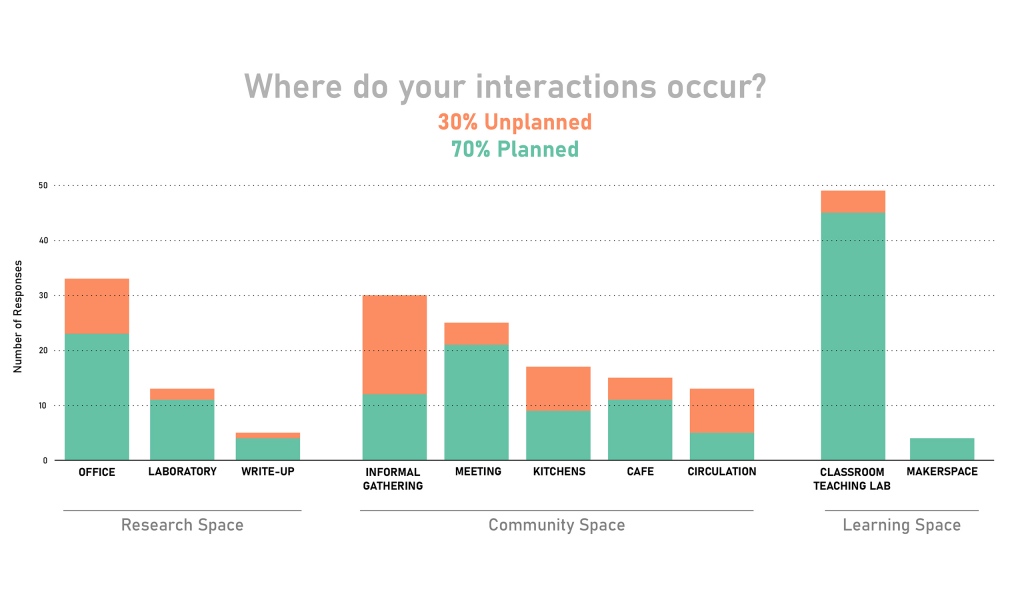
Planned meetings occur in all types of spaces, including informal areas. Fewer interactions occur in labs, while more interactions occur in offices and write-up areas.
Textual responses were analyzed using structural topic modeling – a quantitative analysis that categorizes words in responses relative to specific topics. While the results of the survey below were not strongly positive or negative, the point is that responses can be categorized into topics and then measured.
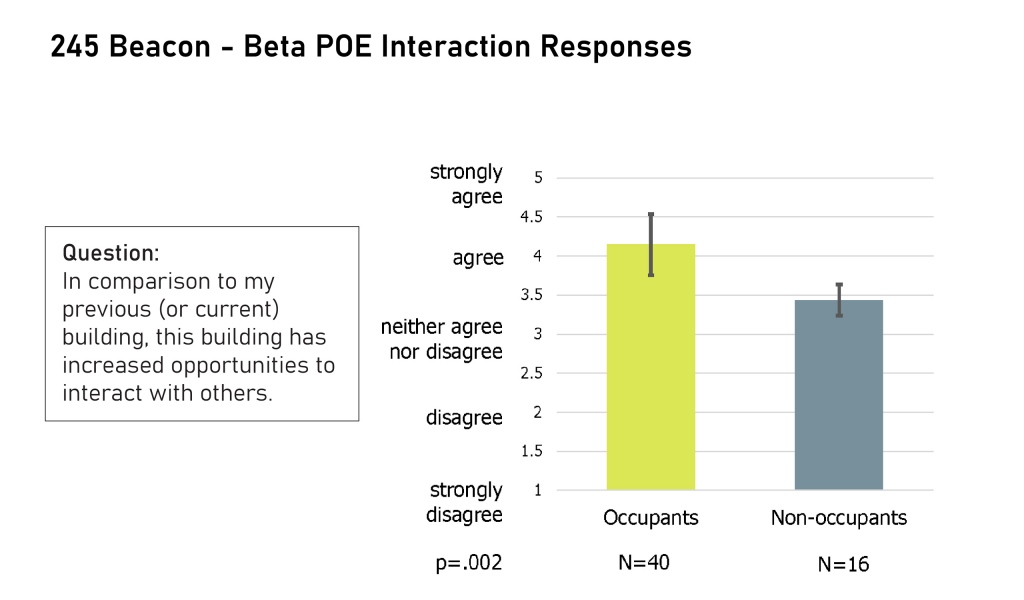
Chart indicates responses by occupants of 245 Beacon and non-occupants. Colored bars indicate mean response with deviation noted in black.
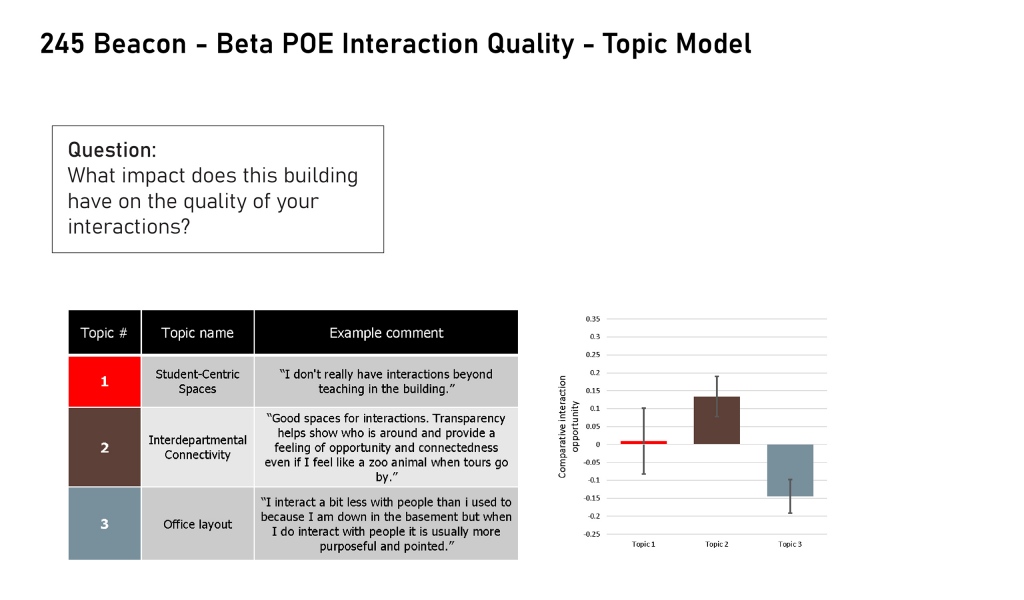
Chart identifies three topics common to the responses to the question. Bar graph indicates the positive (above zero) or negative (below zero) connotation of those responses. Topic modeling enables one to identify common issues cited in response to questions and whether those responses are positive or negative.
We are now embarking on an effort to conduct these surveys on recent projects and are excited to offer the question set to our colleagues in the industry who want to implement a similar survey. We welcome your feedback and offer the following guidance on creating a user experience survey instrument:
Value added by interdisciplinary buildings “To what extent do you agree that ‘In comparison to my previous building, this building has increased my opportunities to interact with others’?”
Life in the building “To what extent do you agree that ‘Informal interactions with those who work outside of my day-to-day group or team has led me to a new research idea?’”
Free-response questions “If you could improve or change anything about the design of the building to improve interaction or collaboration, what would you suggest?”Specific areas or design features of interest: “Please share your thoughts on [insert area or design feature that is of particular interest, e.g., café, open lab space, use of glass, etc.]:”
Conducting a survey first provides an opportunity to validate responses, hear from users first-hand and inquire about performance and durability. The template agenda we use is below.
Tour the building with multiple user groups – faculty, students, postdocs. Ask questions that validate and follow-up on the survey findings.
Take photos of the building in use. Capture everyday happenings, work-arounds and the ways people personalize space.
Tour the building with facilities managers to “kick the tires.” Learn what is durable and what not to specify again. Follow-up on occupant comfort, control systems, safety and operations.
We are in varying stages of deployment and analysis on several post occupancy evaluations and look forward to sharing our findings here on our blog and at upcoming conferences. While there is a strong desire for results and important strategic metrics to consider – utilization, publication rates, patents granted, real-time occupancy metrics, etc. – I believe that people themselves are the amenity and architecture’s influence on culture the most powerful, yet least articulated, impact of inspiring design.


