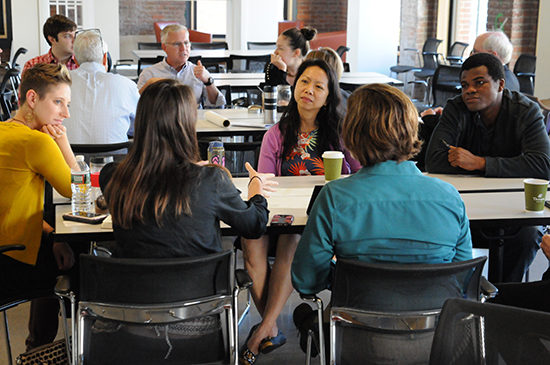
As part of HUBweek 2017, we invited participants from around the city to join us for a conversation about the intersections of sustainable design, resiliency and social equity. All three are big, thorny issues. We know we can’t solve them in a two-hour workshop on a Tuesday, we wanted to foster a conversation about where and how these issues intersect.
Using the Climate Ready Boston Map Explorer as a guide, we looked at the serious vulnerabilities our city faces in the future. From storm surge to heat maps to socially vulnerable populations, the interactive map allows users to understand where need is the greatest. Our session asked the audience to consider ways in which they, as individuals and as members of organizations or communities could have meaningful impact on issues of sustainability, resiliency and equity. We emphasized that even seemingly small changes could have a big impact.
A few statistics:
When we look energy consumption and CO2 emissions by section in the United States, buildings are one of the biggest energy hogs.
44.6%
Buildings make up 44.6% of the CO2 emissions in the United States.
41.7%
Building operations make up 41.7% of energy consumption, compared to “light duty” transportation (automobiles, SUVs, pick-ups, minivans), which represents 16.3% of energy consumption. Other modes of transportation, like air, bus, truck, ships and rail travel only account for 11.8% of energy consumption.
13%
Buildings use 13% of our water.
40%
Building construction uses 40% of raw materials and creates 65% of our waste.
We know in Boston that we’re on the water and are at risk for flooding and sea level rise. By 2050, the sea level in Boston is likely to rise by 1.5’. And that’s likely under all emission scenarios.
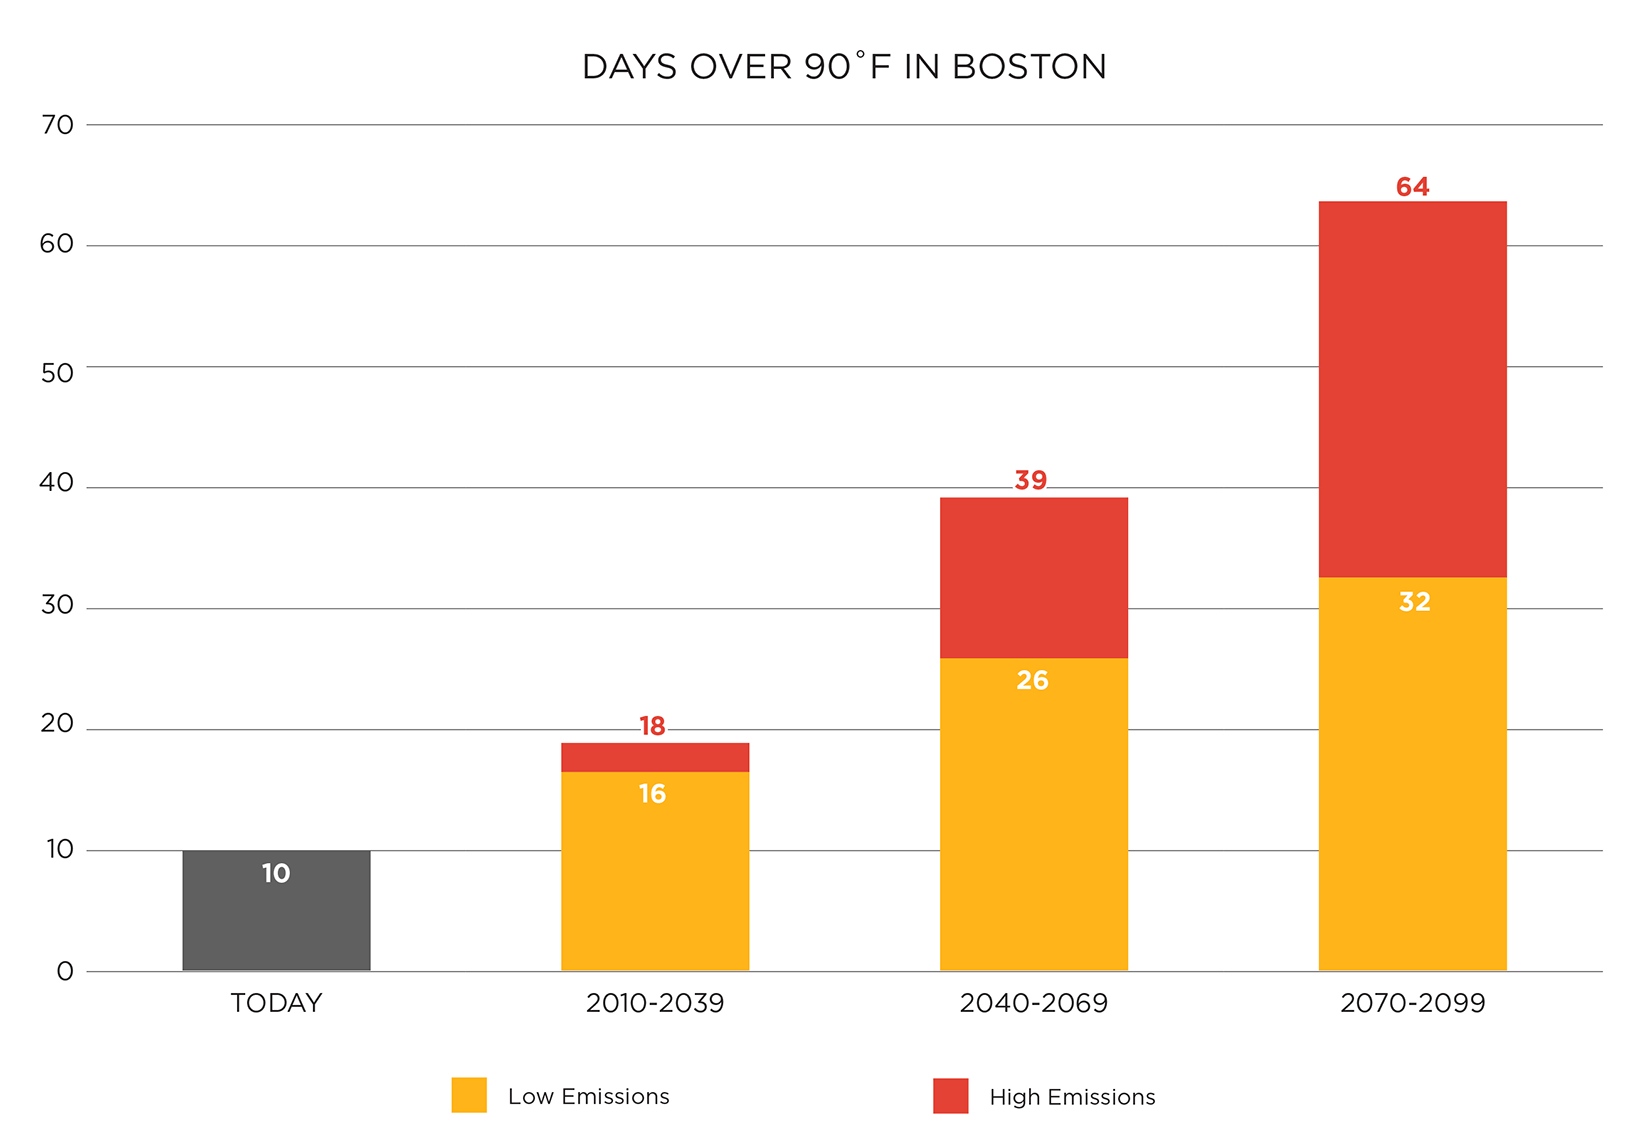
 We’re also at risk in Boston for increased heat exposure vulnerability. The climate is shifting and over time (by 2099) the number of days over 90 in Boston could rise to 64. It’s currently at about 10.
The United States is projected to be a minority majority country by 2050.
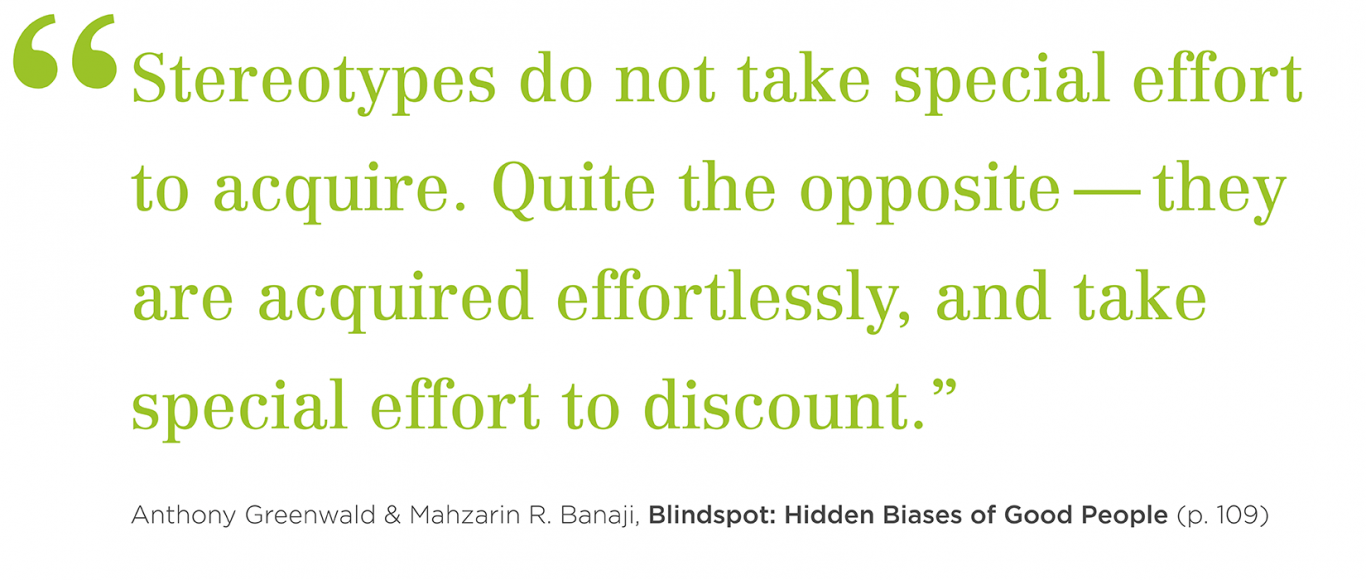
In addition to discussing the relevant metrics, we also asked participants to consider their implicit or unconscious biases. Implicit bias is the bias in judgment and / or behavior that results from subtle cognitive processes that often operate at a level below conscious awareness and without intentional control. Implicit bias is often informed by stereotypes or simple associations.
 To help uncover your bias, check out the Implicit Association Test. There are nine association tests available on a range of topics.
We asked participants to consider the ways they could influence change across a number of issues, like income equity, water use and resilience during catastrophic events. We heard a lot of conversation about who has access to what opportunities in Boston and if they are barriers to accessing them, how to diminish those barriers. Those who joined our discussion cut across a number of disciplines and we were able to share our diverse perspectives and learn from each other.
If you were able to join the discussion, we loved hearing from you! If you couldn’t join us and would like to learn more, we’d love to hear from you!
Resources:
Climate Ready Boston Map
Implicit Association Test
What Works: Gender Equality by Design
What Works: Gender Equality by Design [book]
Blindspot: Hidden Biases of Good People


